Table of content
A quick recap of velocity-based resistance training monitoring and prescription methods
In several previous articles in the series, we discussed monitoring and prescription of resistance training using movement velocity. We addressed many topics. We talked about load-velocity profiles (LVP) for load prescription based on daily readiness to train. We then mentioned velocity loss (VL) thresholds for set termination, (to an extent) volume control, and fatigue quantification. Finally, in the latest article in the series, we discussed some limitations of using VL thresholds in practice and highlighted potential alternatives that also rely on using movement velocity. In that article, we also expanded a bit on the importance of the proximity to failure during resistance training, or in other words, the number of repetitions left in reserve (RIR) once the training set is stopped (for whatever reason using whatever method). The importance of monitoring proximity to failure during resistance training was already highlighted in the literature as researchers observed a linear relationship between proximity to failure and both acute neuromuscular fatigue and negative perceptual responses [1]. Therefore, we concluded that if we prescribe the loads and volume for our athletes or clients in a fixed manner, it is highly likely that we are not taking the proximity to failure they’re at once they stop the set. For instance, let’s assume that our athletes Lisa and Cate can typically do 14 and 10 repetitions with 70% of their one-repetition maximum (1RM) in the free-weight back squat exercise, respectively. Now, if we prescribe them 3 sets of 8 repetitions with 70% of their 1RM, Lisa will finish the set and have 6 and Cate will have only 2 repetitions left “in the tank” upon completing her set. This is a problem, for obvious reasons. Unfortunately, in the previous article, we said that prescribing VL thresholds instead of a fixed number of repetitions cannot really help us to equal the playing field among athletes when it comes to proximity to failure. However, we were also able to see that movement velocity during resistance training has a high relationship with both RIR (i.e., RIR-velocity relationship) as well as the maximal number of repetitions one can do in a set to failure (XRM; i.e., XRM-velocity relationship) [2, 3, 4, 5]. These concepts can be used to take into account proximity to failure when prescribing resistance training workouts for our athletes or clients. While extremely important, we also mentioned one more thing regarding the proximity to failure. Namely, we said that we could simply ask our athletes or clients “How many repetitions do you think you could perform if you wanted to go to failure”? In our example with Lisa and Cate, we would hope that they would say 2 and 6 repetitions respectively after completing the set of 8 repetitions with their 70% of 1RM. Clearly, this represents a subjective approach to gauging proximity to failure which is often referred to as “exertion” during resistance training. Therefore, if our athletes or clients tell us their estimated RIR upon completing their set, they are essentially providing us with the rating of (their) perceived exertion (RPE). Many different scales have been historically used to assess the RPE of our athletes and clients during training. In this article, we aim to provide some context for RPE assessment during training, how can it be used to monitor and prescribe resistance training, and compare and contrast one popular RPE scale with a velocity-based approach to resistance training monitoring and prescription.
What is the rating of perceived exertion and how do we use it to monitor training in general?
The original RPE scale, developed by Gunnar Borg, was primarily used to monitor aerobic exercise and rated exertion from 6 to 20 [6]. However, its application to resistance training was limited as the scale was predominantly concerned with matching the heart rate responses to exercise. Subsequently, Borg’s “CR10” scale was introduced, being the first scale providing exertion ratings from 1 to 10. Shortly after, the visually aided 1-10 RPE scale known as the OMNI scale was also developed and popularised among coaches and trainees [7]. The RPE scores can be utilized in different ways when managing our athletes’ or clients’ resistance training programs. Their RPE scores can be obtained from our athletes or clients after each exercise or group of exercises, or alternatively, the session RPE method can be employed. The session RPE involves obtaining an RPE score from our athletes or clients after they completed the entire training session, typically 30 minutes after its completion. This method can be used to prescribe intensity for an entire session or monitor the overall response to training over time which is useful to make more educated training and recovery adjustments to the overall training plan of our athletes or clients. However, if we want to be a bit more precise and prescribe loads during resistance training on a set-to-set basis using the traditional RPE scales previously described, we probably need a different scale. Why is this? Well, think about it. Let’s say that we prescribed our athletes to lift the same relative load in the same exercise and stop the set when they perceive its difficulty to be “12 out of 20”, or when they think that the difficulty of the set is “5 on a scale ranging from 1 to 10”. It is fair to say that “difficulty” or “how hard is the task” is interpreted by different people in different ways and thus can be misleading when monitoring and prescribing resistance training. This is because two different people can rate the set with the same RPE, yet the amount of work completed and left “in reserve” can be vastly different. In other words, people could be led by some other internal sensations when providing you with the RPE score, and factors such as pain, discomfort, boredom, and breathlessness can all affect their ratings. This is not necessarily bad, but the truth is that this score wouldn’t give us, coaches, the idea about the proximity to failure at which our athletes stopped their set.
A traditional rating of perceived exertion scales don’t work well in resistance training
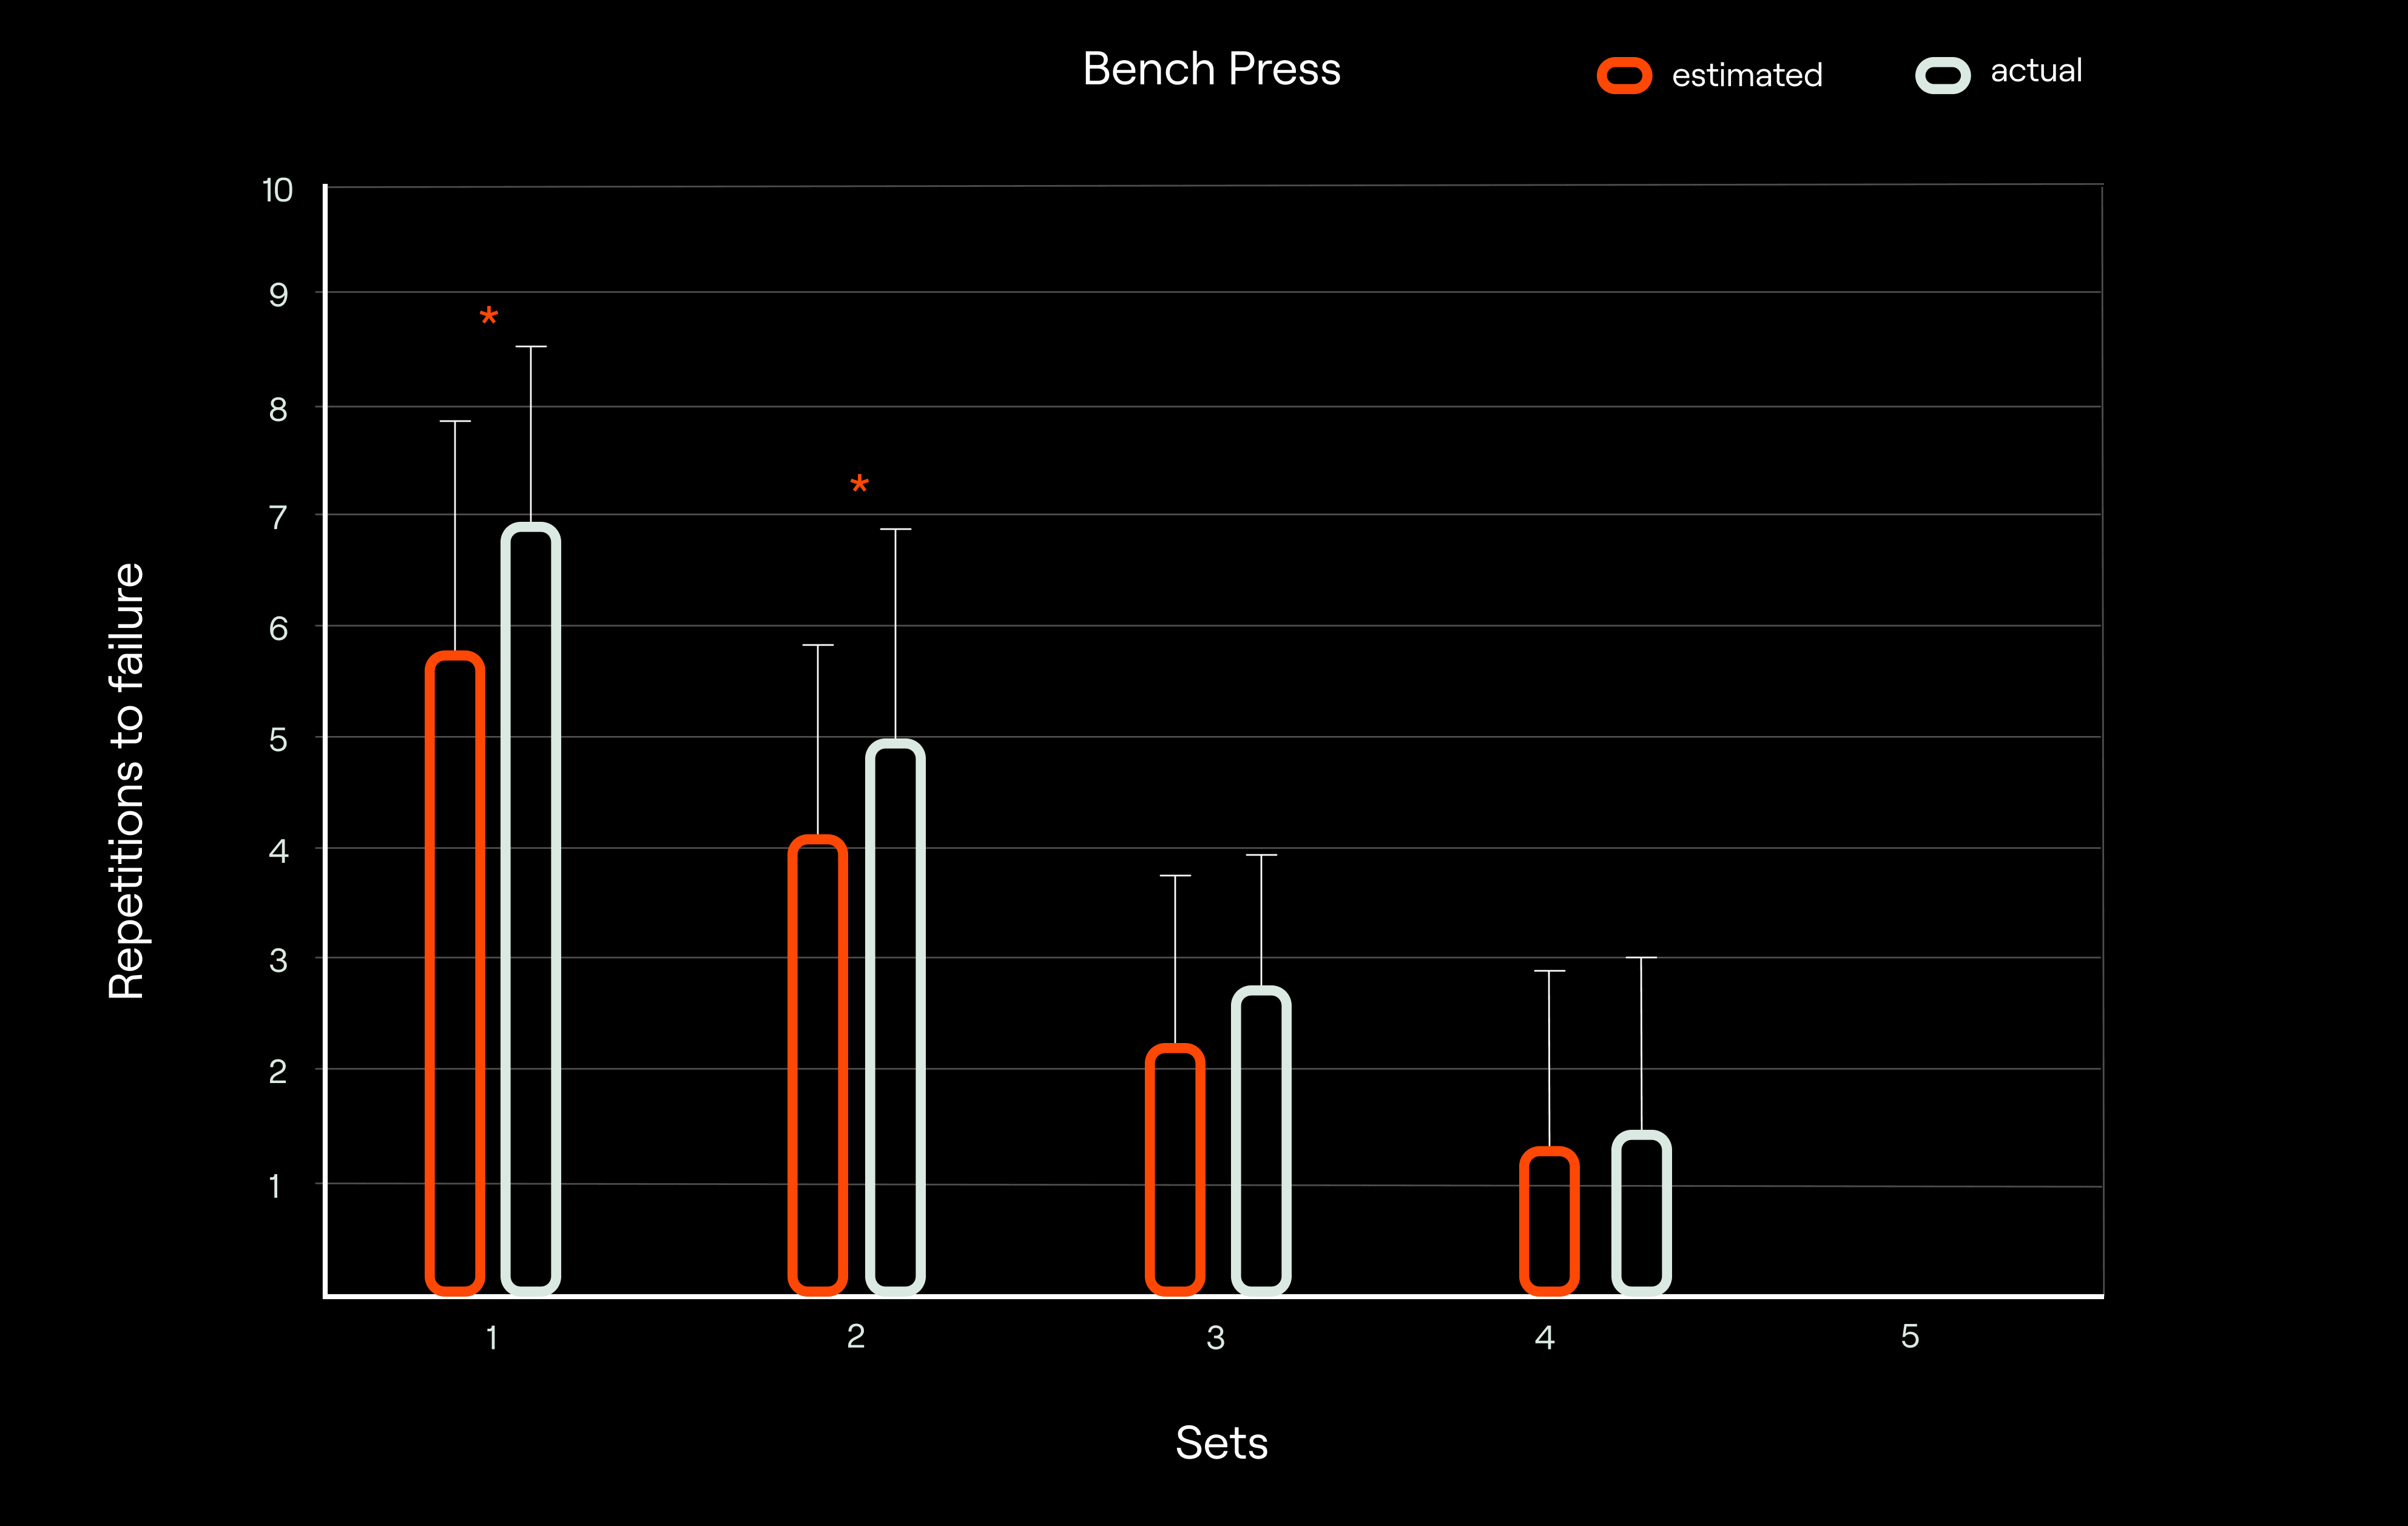
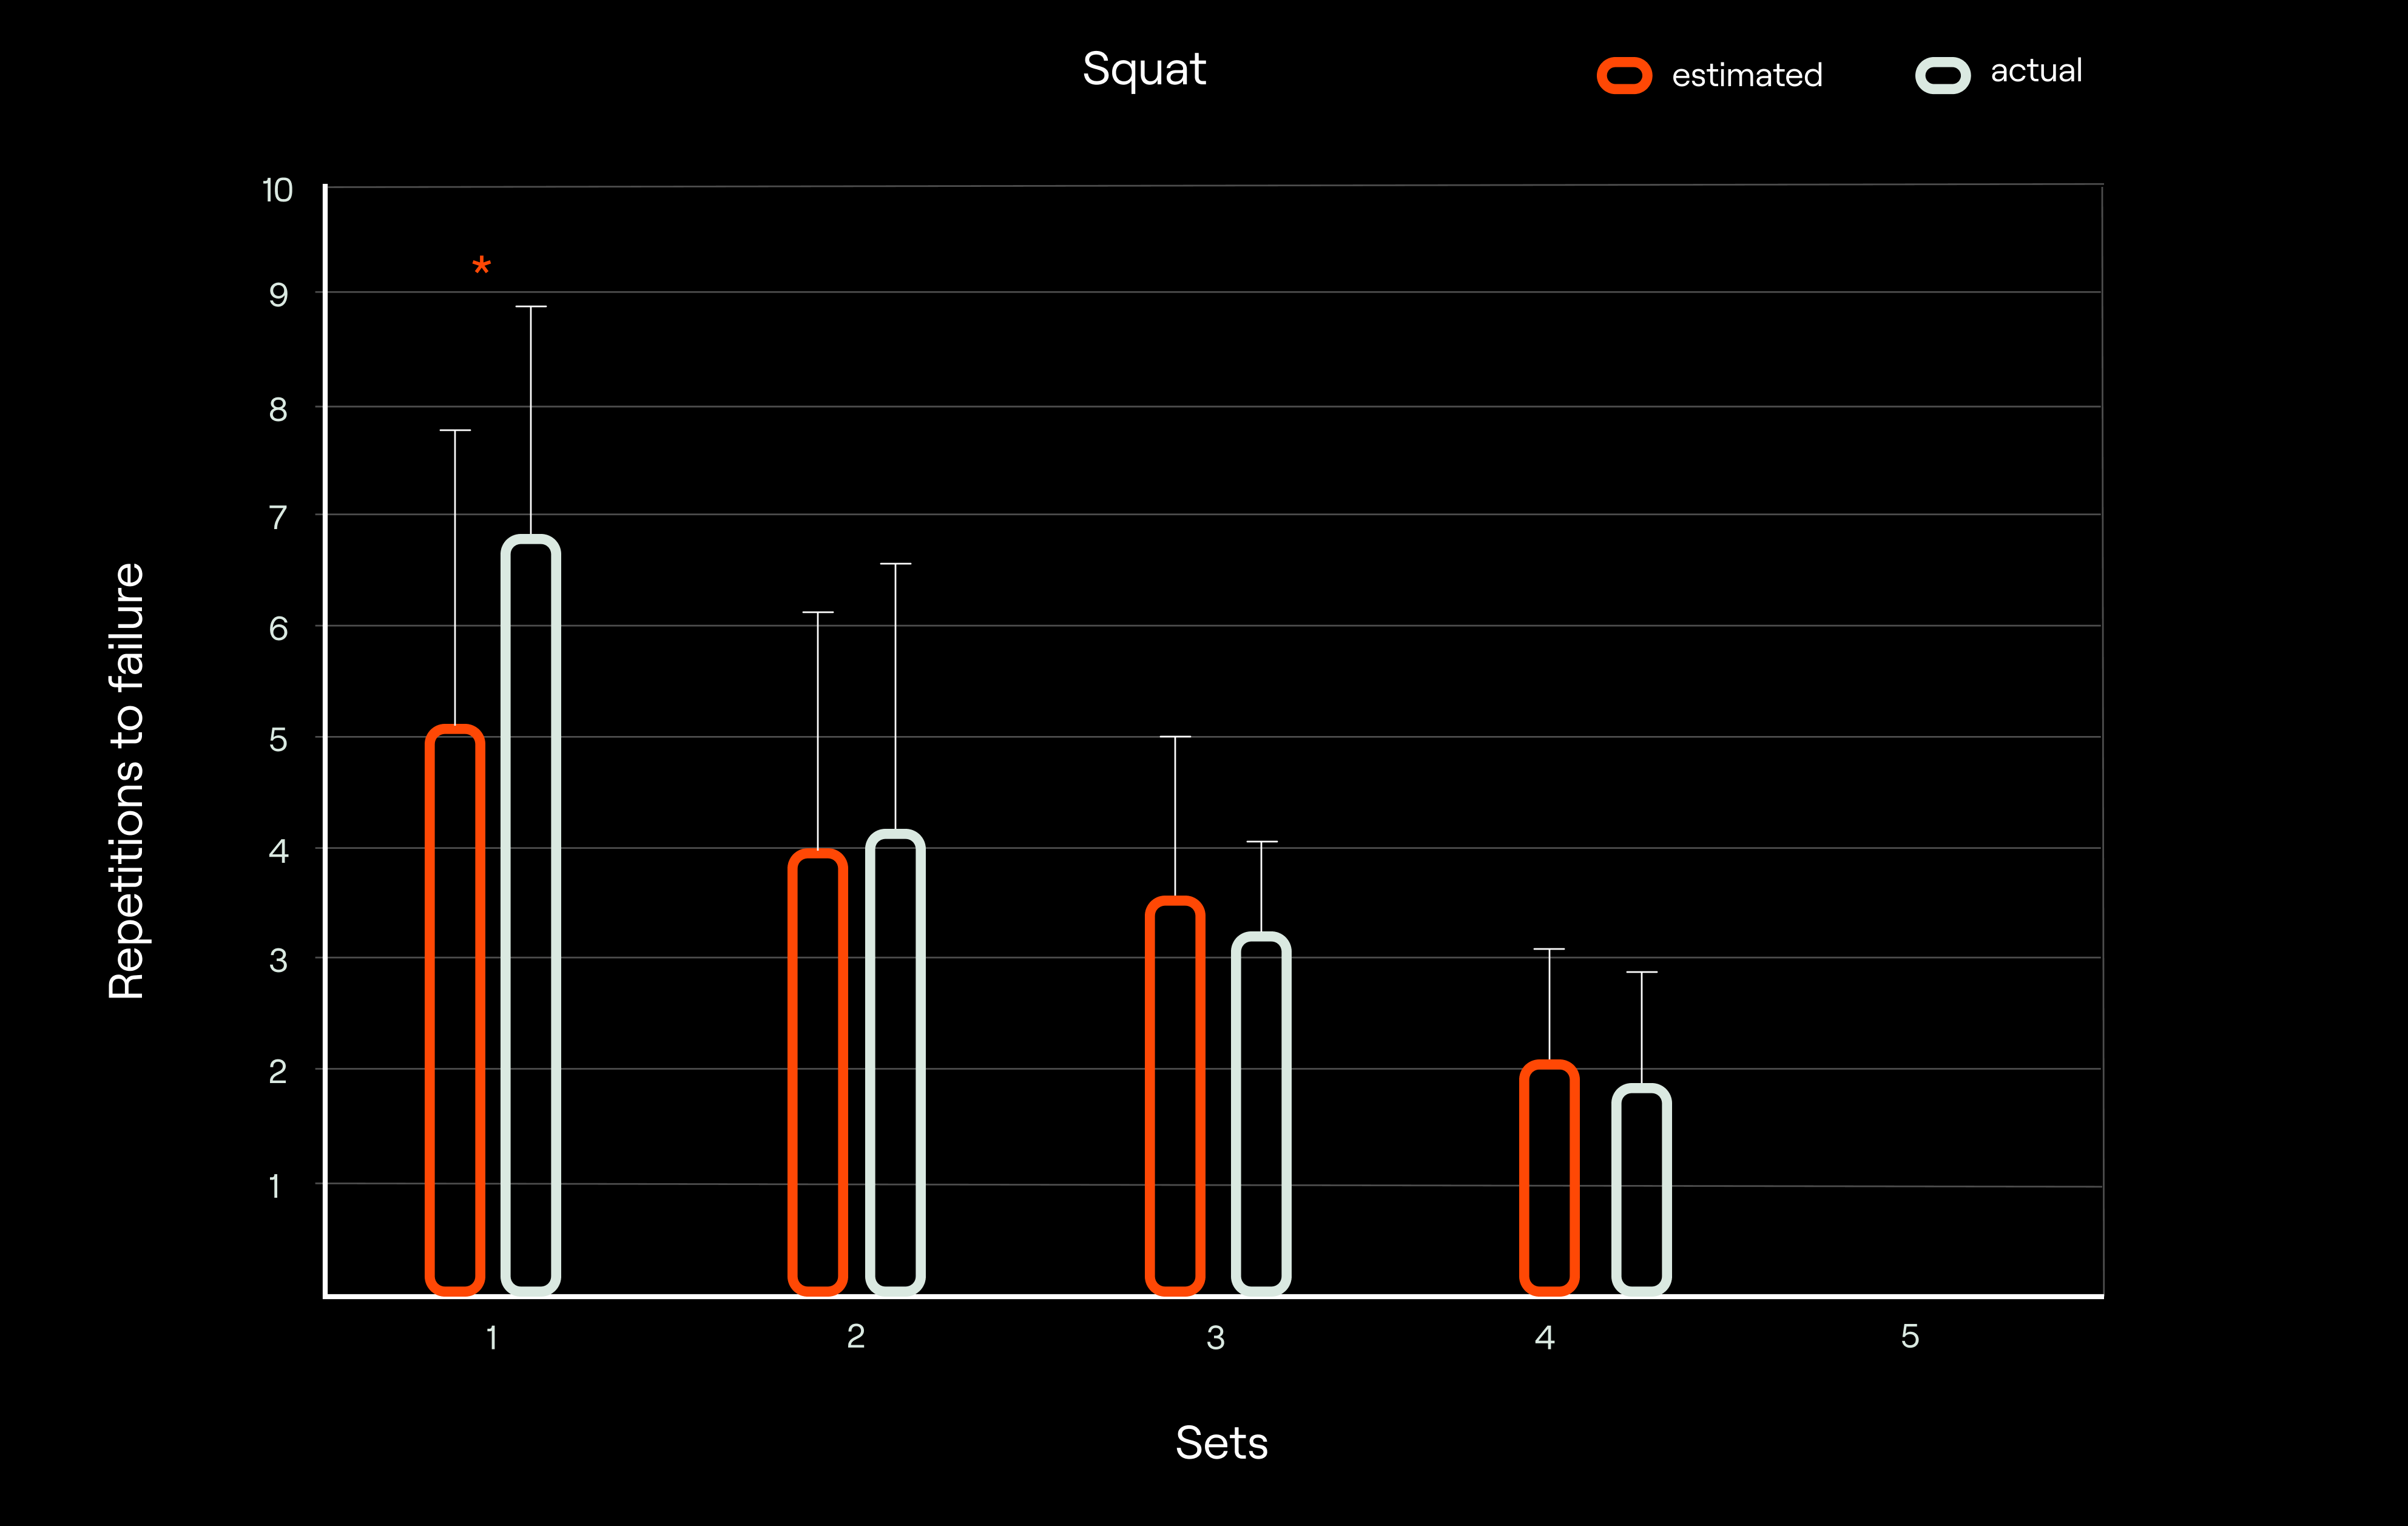
Ok, so we now established that the traditional RPE scale has limitations when applied in the resistance training context. To really drive this point home, let’s consider the study by Hackett et al. [8] who had bodybuilders performing the bench press and squat exercises. More specifically, the bodybuilders were instructed to perform 5 sets of 10 repetitions (or until failure) at 70% of 1RM. After completing the 10th repetition in each set, participants reported the number of additional repetitions they believed they could perform before reaching failure and also provided a 1-10 RPE score (what they did first was randomized across sets). After this, they continued to muscle failure in order to determine the maximum number of repetitions possible, and thus the actual number of repetitions left in “the tank”. The most interesting observation from this study was that participants consistently reported RPE ratings below the maximal on the scale (in their case, less than 10) even when sets were taken to volitional failure (i.e. when they had 0 repetitions left in reserve). This pretty much confirms what we concluded before when we said that people can interpret “difficulty” or how hard the task is” – what typically RPE scales ask about – in a different way. Additionally, participants showed a high level of accuracy in estimating the number of repetitions remaining in a set. This means that RPE scales should probably ask different questions in the context of resistance training. Namely, if people can predict, with reasonable accuracy, how many additional repetitions they could have done – if they wanted to reach muscle failure – once they stopped the set, then RPE scales should be asking a question that is precisely determining that.
Explaining the perceived exertion scale specific to resistance training contexts
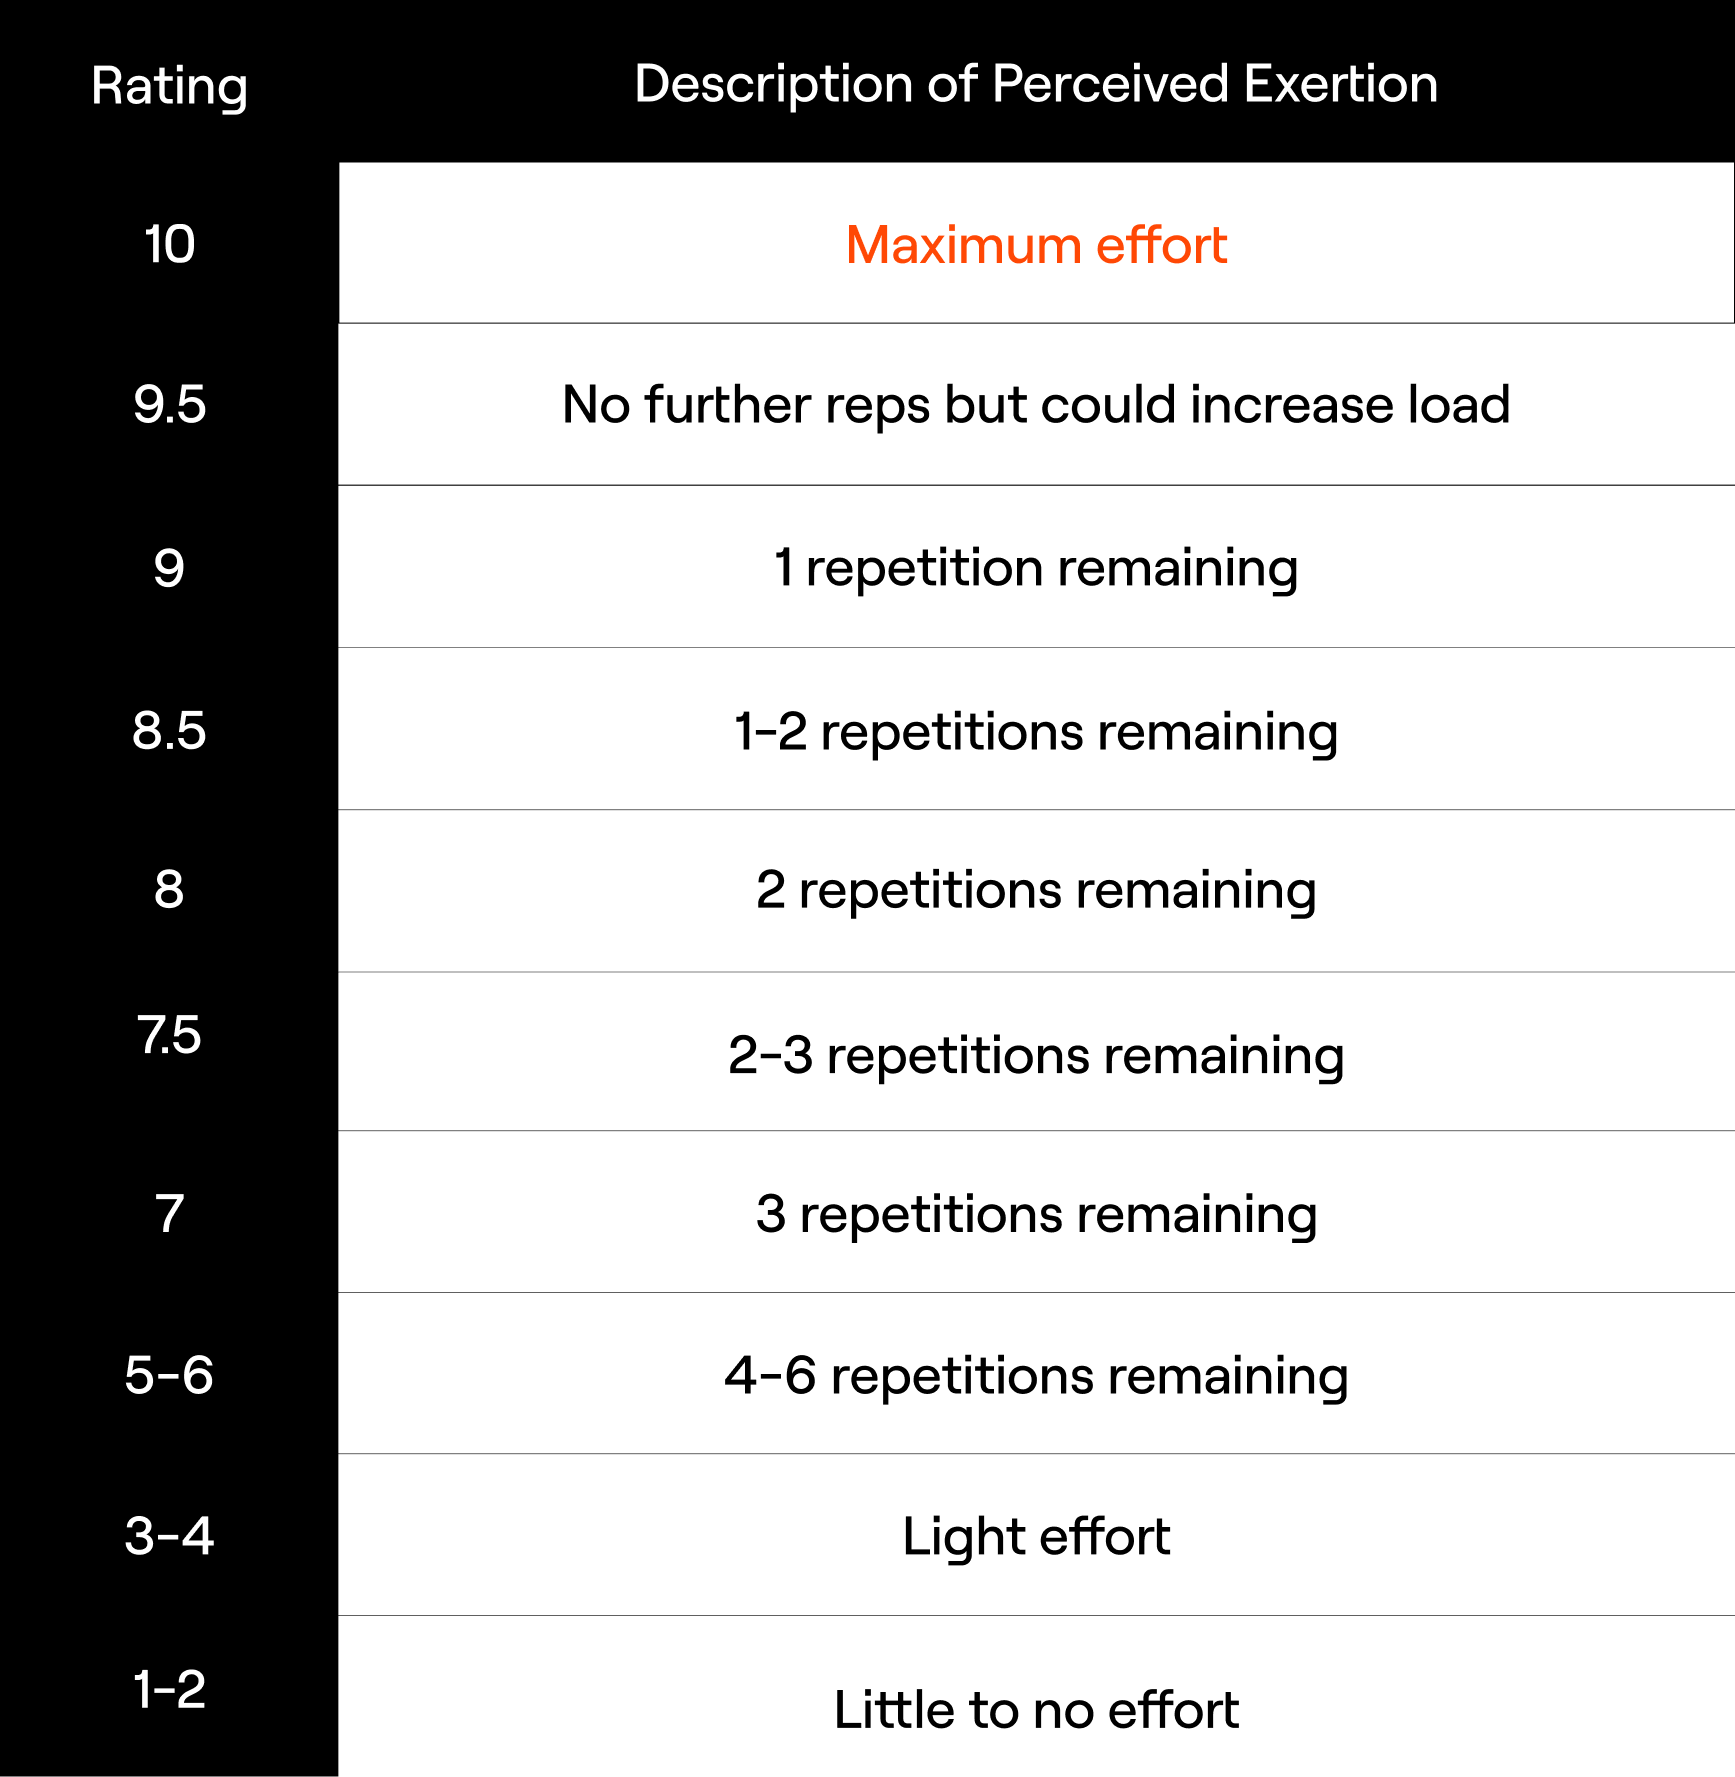
Coaches and researchers recognized this problem with the traditional RPE scale in the context of resistance training monitoring and prescription. Therefore, it was only a matter of time before a scale targeting the proximity to failure during resistance training was developed. Zourdos et al. [9] were the first to introduce such an RPE (1-10) scale to the scientific literature1. In this scale, which goes from 1 to 10, each RPE score corresponds to a given RIR. The scale can be found in the figure below [9]. It is easy to notice that the scale presents an inverted relationship with RPE scores whereby higher RPE denotes lower RIR (i.e., harder set means fewer repetitions left “in the tank”). For instance, 9, 8 and 7 RPE correspond to 1, 2, and 3 RIR, respectively. Additionally, scores of 5-6 were grouped as 4-6 RIR to allow individuals to provide a range of RIR when it exceeds 3 as it may be difficult for them to be very precise otherwise. Generally speaking, it is also worth noting that this scale uses RIR descriptors for scores ranging from 5 to 10, and descriptors of perceived effort for scores ranging from 1 to 4. On the surface, it seems that 9.5 and 10 RPE also describe the effort, but in reality, both 9.5 and 10 RPE correspond to 0 RIR. The only difference is that 9.5 RPE means that individuals feel as though some load could still be added to the barbell whereas calling a 10 RPE for a given set means that no more repetitions could be performed, and no more loads could be added to the barbell. Not only did Zourdos et al. [9] find this scale to be valid, but they also outlined a rather broad application of this RIR-based RPE scale in the resistance training context. For example, this scale could be used to 1) account for individual differences in the number of repetitions performed with a given %1RM; 2) continuously adjust the load used with our athletes or clients based on the desired number of RIR for that training session and the goals of the entire training block (e.g., maximal strength, power, endurance, hypertrophy blocks) to ensure appropriate adaptation; and 3) monitor velocity during “power-based” training sessions whereby the set can be terminated once a maximum RPE is reached (e.g., RPE 3-4), to maintain the desired training stress by keeping the velocity outputs relatively high. Collectively, this RIR-based RPE scale specific to resistance training can be incorporated into any training model to assign appropriate training loads and ensure that our athletes or clients experience the desired level of stress, particularly when training variables are frequently modified. Therefore, implementing the RIR-based RPE approach to resistance training provides a practical and effective way for individuals and teams to experience a similar training stimulus while minimizing the risk of failure.
Limitations of the rating of perceived exertions scale
Ok, so why not just use RIR-based RPE for resistance training? Well, there are several limitations and considerations associated with it that are worth considering. Although the use of RPE with your athletes or clients allows for the modification of sessional loads based on their perceived readiness to train [9], it is a subjective approach to resistance monitoring and prescription. Additionally, when you use RPE to prescribe workouts, your athletes or clients are required to perform a given number of repetitions in a set until adjustments can be made, making this a trial-and-error method. These two considerations are not necessarily an issue. However, they can be, especially with less experienced trainees who don’t have a lot of experience with resistance training or simply experience with using the RPE scales in their training. In fact, it has been shown that the ability to accurately gauge traditional RPE is greater in those experienced with resistance training compared with novices [10], and this also seems to hold true when using an RIR-based scale [9]. Therefore, our less experienced athletes or clients should first practice recording RIR during their resistance training workouts, and we should probably avoid basing their training intensity or progression solely on the RIR-based scale until sufficient accuracy is achieved. The latest meta-analysis on the topic [11] indicates that individuals are generally imperfect in their ability to predict proximity to task failure (i.e., what is their RIR score for the set) independent of their training background. However, it seems that people improve their accuracy when they provide their RPE scores closer to task failure, when using heavier loads, or in later sets. This is encouraging as it means that our athletes or clients can still provide (more) accurate RPE scores in later stages of ongoing sets when the number of repetitions is relatively low, in later sets, and with heavier loads. Collectively, this suggests that the utility of RPE scales, and RIR-based RPE scales in particular, increases as the training experience increases and/or when the fatigue accumulates during resistance training. As such, this tool has its guaranteed place in the coaching toolbox; though, we should be aware of its limitations.
The pros and cons of objective and subjective approaches to resistance training monitoring and prescription
We now covered the applications of the most popular RPE scale in the resistance training context and outlined its potential limitations. It must be noted that we only scratched the surface, but the general idea is there. The question now is how the velocity-based approach to resistance training monitoring and prescription fits into all of this. Well, compared to the RPE “method”, the velocity-based “method” is objective as it utilizes well-grounded physiological principles. For example, as you lift heavier loads, you will slow down. The same will happen as you perform repetitions in a consecutive fashion and accumulate fatigue. As such, there is less trial-and-error involved with the velocity-based approach to resistance training. Also, while monitoring movement velocity during resistance training, we have 1) greater insight into our athletes’ or clients’ needs; and 2) the ability to quantify the degree of fatigue they are experiencing in a training set or what absolute load should they put on the barbell to match the intended relative load for the day. More specifically, and for example, based on the load-velocity profiles, we can compare and contrast our athletes against each other, determine what they need to work on to improve their sporting performance, evaluate changes in performance, and more. On the other hand, quantifying velocity loss during resistance training can help us determine appropriate recovery strategies with our athletes, and give us a better insight into the amount of work our athletes can do within each fatigue threshold, which could then be used to compare and contrast athletes and make changes to our athletes’ training based on their needs and the demands of their sport. To keep this article balanced, we need to also emphasize that a velocity-based approach to resistance training relies on the ability of our athletes and clients to provide maximal intent during every repetition, as highlighted in a previous article. This may sound like a limitation, as athletes or clients that you work with wouldn’t be able to perform repetitions “however they want”. However, it is important to appreciate that performing repetitions at the maximal intended velocity, compared to performing repetitions at a self-selected pace, leads to greater strength gains and better performance of sport-specific tasks [12, 13], all other things being equal. The only true downside of a velocity-based approach to resistance training is that you need some sort of device to implement it in your work with athletes or clients. There are many options on the market. They all differ in how valid, reliable, bulky, convenient, and expensive they are. Obviously, we would want a device that is at least reliable, wireless, convenient, and inexpensive. Thanks to technological advancements, there are devices on the market that have these desired characteristics, and one such device is Enode. Nevertheless, the key advantage of the velocity-based approach to resistance training is that you don’t have to leave (almost) anything to chance.
How Enode eliminates many of the downsides associated with the objective approach to resistance training monitoring and prescription
Now, that we covered both subjective and objective “methods” of monitoring and prescribing resistance training, we can hopefully appreciate their upsides and downsides. Based on everything we’ve said so far and assuming that one is willing to purchase the device that allows the implementation of a velocity-based approach to resistance training, it seems that there really is no reason to care about subjective “methods”. We don’t think that’s the right conclusion. Instead, we feel as though integrating percentages of your athletes’ or clients’ 1RM, their reported RPEs (or RIRs), and different movement velocity variables is the best way to go about resistance training. While monitoring movement velocity will reflect changes that you’re after so that you can make training adjustments in almost real-time, considering other concepts mentioned here is also important to have some context and thus see a bigger picture in the overall training process of your athletes or clients. Thankfully, some smartphone, tablet, or web applications out there already do all of this for you. Enode sensor comes with one such application that links your athletes’ or clients’ 1) 1RMs and velocities associated with them; 2) relative loads lifted and velocities associated with them, 3) subjectively reported RPE/RIR; 4) objectively determined RPE/RIR based on movement velocities; and 5) velocity loss experienced in a training set. With all this information integrated, the AI algorithms within the application are able to provide educated training recommendations.
- Although Zourdos et al. (2016) introduced an RIR-based RPE scale to the scientific literature while publishing a validation study on the topic, a similar scale was originally created in “The Reactive Training Systems Manual” by Mike Tuchscherer back in 2008 for application in powerlifting-style training. ↩︎
References
- Refalo, M. C., Helms, E. R., Hamilton, D. L., & Fyfe, J. J. (2023). Influence of resistance training proximity-to-failure, determined by repetitions-in-reserve, on neuromuscular fatigue in resistance-trained males and females. Sports Medicine-Open, 9(1), 10.
- García-Ramos, A., Torrejón, A., Feriche, B., Morales-Artacho, A. J., Pérez-Castilla, A., Padial, P., & Haff, G. G. (2018). Prediction of the maximum number of repetitions and repetitions in reserve from barbell velocity. International Journal of Sports Physiology and Performance, 13(3), 353-359.
- Miras-Moreno, S., Pérez-Castilla, A., & García-Ramos, A. (2022). Lifting velocity as a predictor of the maximum number of repetitions that can be performed to failure during the prone bench pull exercise. International Journal of Sports Physiology and Performance, 17(8), 1213-1221.
- Jukic, I., Helms, E. R., & McGuigan, M. R. (2023). The fastest repetition in a set predicts the number of repetitions completed to failure during resistance training: The impact of individual characteristics. Physiology & Behavior, 265, 114158.
- Morán-Navarro, R., Martínez-Cava, A., Sánchez-Medina, L., Mora-Rodríguez, R., González-Badillo, J. J., & Pallarés, J. G. (2019). Movement velocity as a measure of level of effort during resistance exercise. The Journal of Strength & Conditioning Research, 33(6), 1496-1504.
- Borg, G. (1998). Borg’s perceived exertion and pain scales. Human kinetics.
- Faulkner, J., & Eston, R. G. (2008). Perceived exertion research in the 21st century: developments, reflections, and questions for the future. The Journal of Exercise Science and Fitness, 1-14.
- Hackett, D. A., Johnson, N. A., Halaki, M., & Chow, C. M. (2012). A novel scale to assess resistance-exercise effort. Journal of Sports Sciences, 30(13), 1405-1413.
- Zourdos, M. C., Klemp, A., Dolan, C., Quiles, J. M., Schau, K. A., Jo, E., … & Blanco, R. (2016). Novel resistance training–specific rating of perceived exertion scale measuring repetitions in reserve. The Journal of Strength & Conditioning Research, 30(1), 267-275.
- Eston, R. G., & Williams, J. G. (1988). Reliability of ratings of perceived effort regulation of exercise intensity. British Journal of Sports Medicine, 22(4), 153-155.
- Halperin, I., Malleron, T., Har-Nir, I., Androulakis-Korakakis, P., Wolf, M., Fisher, J., & Steele, J. (2021). Accuracy in predicting repetitions to task failure in resistance exercise: a scoping review and exploratory meta-analysis. Sports Medicine, 377-390.
- González-Badillo, J. J., Rodríguez-Rosell, D., Sánchez-Medina, L., Gorostiaga, E. M., & Pareja-Blanco, F. (2014). Maximal intended velocity training induces greater gains in bench press performance than deliberately slower half-velocity training. European Journal of Sport Science, 14(8), 772-781.
- Pareja-Blanco, F., Rodríguez-Rosell, D., Sánchez-Medina, L., Gorostiaga, E. M., & González-Badillo, J. J. (2014). Effect of movement velocity during resistance training on neuromuscular performance. International Journal of Sports Medicine, 916-924.